

Sales indicators allow them to effectively make the right decision.
A study by Oracle Netsuite has rightly revealed that 82% of French managers have difficulty making a decision for fear of making a mistake. With sales indicators, it is possible to make precise and informed decisions.
Why use KPIs?
Sales indicators make it possible to measure a result or the evolution of an action implemented (for example sales and marketing actions). They are tools for assessing your results.
How to measure sales?
To measure sales, it is necessary to rely on clear and precise key performance indicators (KPIs). But for them to be effective, they must keep the same definition over time to be comparable and show the evolution.
A widely used example: the average basket. This ratio estimates the average amount spent by customers.
What is a sell indicator?
A sales indicator is a tool for evaluating the achievement of an objective. The indicator allows you to:
Set up a new tool (an ERP or a CRM for example)
Assess the effectiveness of the marketing and sales actions carried out
Monitor business activity in real time
The 10 sales indicators to absolutely follow
There are different sales indicators. However, some deserve more attention than others.
What are the main business KPIs to track?
We find :
Turnover
The conversion rate
Customer lifetime value
customer acquisition cost
Churn rate
The retention rate
The NPS (Net Promoter Score)
Salespeople’s goals
Gross margin
The average length of the sales cycle
The most important business KPI: revenue
The turnover is presented as the first performance indicator of a company’s sales. The turnover makes it possible to position the company in relation to its competitors and to evaluate its market shares.
The turnover of a company is equal to the sum of the selling prices of the products or services rendered invoiced by the company to a customer. It can be expressed excluding tax (HT) or all taxes included (TTC).
The calculation of the turnover can be done in any period. But most often, it is calculated monthly, quarterly and annually.
Turnover = selling price x quantities sold |
The conversion rate
Conversion rate refers to the percentage of visitors to a site who have taken a desired action. It makes it possible to determine the number of people who have done what is expected of him among an initial population.
The conversion rate helps gauge the effectiveness of a marketing campaign.
(Number of people who carried out the action / number of visits) x 100 |
Example: if an e-commerce site has 1,000 visitors and 125 of them have made a purchase, the conversion rate for this company is 12.5%.
(125 / 1000) x 100 = 12.5%.
The customer acquisition cost (CAC)
Customer acquisition cost is the average amount spent to acquire a new customer. This indicator reflects all the expenses related to the transformation of a prospect into a customer thanks to marketing and sales campaigns. The cost of customer acquisition allows you to gauge the efficiency and profitability of your business model.
To give you ideas, here are some CACs by industry shared by Seingsights :
Trip: €7
Transportation: €98
Technology (hardware): €182
Technology (software): €395
Real estate: €213
CAC = (CM + CC) / AC CAC: Customer Acquisition Cost CM: Total cost of marketing investments to acquire a customer CC: Total business investment cost to acquire a new customer Turnover: Turnover |
Example: your company allocates €500,000 per year for marketing and sales campaigns. If it generates 150 sales over the period, its CAC is equivalent to €3,333.
(50,000/150) = €3,333
If it makes 200 sales, the CAC drops to €2,500.
Customer lifetime value
The customer lifetime value (CLV) is an estimate of what a customer can bring to the company during the customer relationship. She allows to :
Get to know your customers better
Know which customers the company should focus on
Define how much the company should spend to attract and retain customers, while remaining profitable in the long term
CLV (e-commerce) = average basket of purchases x average frequency of purchases x customer lifetime CLV (SaaS and subscription) = recurring subscription x customer lifetime |
Average basket = turnover / number of orders
Average purchase frequency = number of orders / number of customers
Customer lifetime = 1 / (1 – retention rate)
Let’s take the example of a company that achieves a turnover of €975,000 per year. His annual orders amount to 10,000 orders and he has 500 customers with an 80% retention rate!
Its average basket is €97.5: (975,000 / 10,000) = €97.5
Its average purchase frequency is 20 orders per year and per customer: (10,000 / 500) = 20 orders
The customer lifetime is 5 years: (1 – (1 – 80%) = 5 years
This makes CLV equal to €9,750: (97.5 x 20) x 5 = €9,750
This means that a customer generates an average of €9,750 in revenue during their life cycle in the company.
The CLV must be operated in parallel with the CAC. This allows the company to know what the customer is earning it. This gain is reflected in the margin over the CLV – CAC period.
In our example, if the CAC is €1,000, each customer contributes €8,750 (9,750 – 1,000) to the company’s results over 5 years.
The attrition rate
Attrition rate refers to the proportion of customers lost during a given period. Preferably, it is calculated regularly.
This indicator allows you to assess your customers’ satisfaction with the services you offer.
Attrition rate =[nombre de clients perdus / Nombre total de clients] x100 |
If an insurance company has 1,000 customers and during the year 200 of them choose another insurance company, its annual attrition rate is 20%.
(200/1000) x 100 = 20%
The retention rate
Loyalty rate or customer retention rate is the exact opposite of churn rate. Customer retention rate refers to the proportion of customers that the company has retained over a given period.
Like the churn rate, it measures customer satisfaction. A high retention rate means that your customers are satisfied with the services you offer.
Loyalty rate = [(F – N) / D] x 100 F: number of customers at the end of the period N: number of new customers over the period D: number of customers at the beginning of the period |
Take the case of a delivery company. At the beginning of 2022, it has 200 clients to its credit. At the end of 2022, it has 400 customers. During the year 2022, it gained 300 new customers. Its annual retention rate is therefore 50%.
[(400 – 300) / 200] x 100 = 50%
The NPS (Net Promoter Score)
This indicator assesses customer satisfaction and loyalty. It allows you to categorize customers into 3 types :
Passives
The promoters
The detractors
We calculate the NPS from a specific question: “Do you recommend our service to your relatives?”. The answer to the question is expressed on a scale of 0 to 10. Customers are:
Detractors if the rating is between 0 and 6
Passive if the rating oscillates between 7 and 8
Promoter if the score varies from 9 to 10
The NPS is calculated from the percentages of these categories:
NPS =% of promoters -% of detractors |
Here are the NPS of some famous big companies :
Apple: 72
Tesla: 97 (we couldn’t find better!)
Amazon: 69
Netflix: 64
Starbucks: 77
For information, the banking sector in France has a negative average NPS (- 3).
We can therefore say that an NPS is:
Bad below 0
Correct when greater than 0 and less than 30
Very good between 30 and 70
Excellent when over 70
Salespeople’s goals
This indicator allows you to know if the objectives set up are unachievable or too low for the company. If less than 60% of salespeople are able to achieve them, the goals are unachievable. If, on the other hand, 90 to 100% of salespeople reach them, they are too low.
Achievement of sales objectives = (achieved objectives / planned objectives) x 100 |
Let’s calculate the percentage of achievement of a turnover objective. Out of 80 sales reps, 50 reached their goal. The percentage of objective achievement is therefore 62.5%.
(50 / 80) x 100 = 62.5%.
Gross margin
Gross margin (or contribution rate) is the earnings made by a business over a period of time (before fixed charges).
Gross margin = sales of goods (HT) – purchase costs of goods and variable costs Gross margin rate = gross margin / sale of goods (HT) x 100 |
Example: during the year 2021, the purchase cost of the company’s goods is €500,000 (excl. VAT). Its merchandise sales amount to €750,000 (excl. VAT).
The gross margin is €250,000: (750,000 – 500,000) = 250,000
The margin rate is 33.3%: (250,000/750,000) x 100 = 33.3%
The average length of the sales cycle
The average sales cycle time corresponds to the time that elapses between the qualification of the prospect and the closing of the sale. This indicator allows the company to estimate the time it spends for its customers.
Sales Cycle Duration = number of days from time of lead qualification to signing Average sales cycle length = sum of sales cycle times per customer / number of customers |
Follow your sales indicators with a dashboard
Because there are several sales indicators, you must invest in a powerful tool to ensure optimal monitoring. Hence the interest of a dashboard.
What is a Business Dashboard?
A commercial dashboard is a document for monitoring the evolution of commercial activity in relation to the objectives set.
Why use a dashboard for your business KPIs?
The use of a dashboard for its commercial KPIs makes it possible to give a directive line to the commercial and marketing teams.
The dashboard gives you elements for assessing the current situation: you can directly assess the relevance of the actions taken. This allows you to make decisions quickly and efficiently.
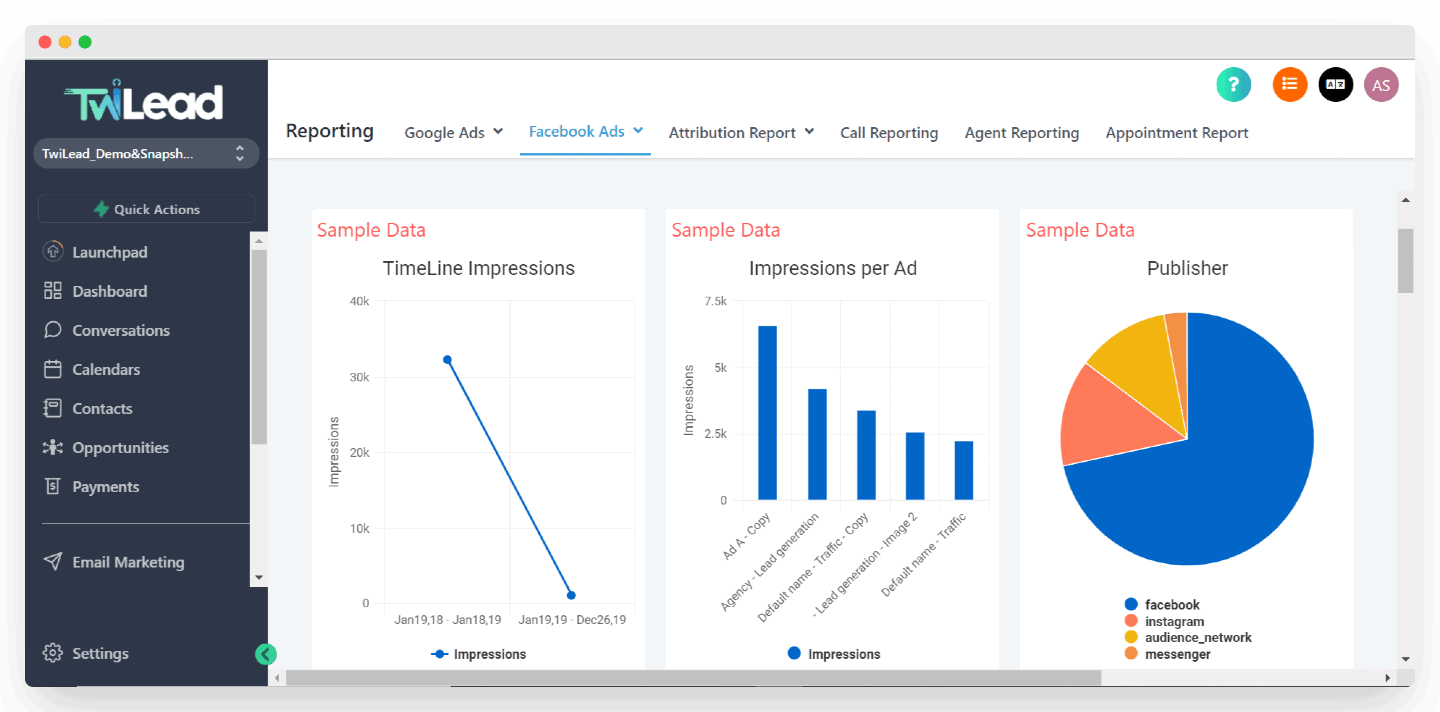
Note: Using a dashboard for business KPIs is possible with some CRMs, including Twilead .
Conclusion: How to succeed with your sales indicators?
The exploitation and in-depth analysis of sales indicators allow entrepreneurs to make effective decisions.
To succeed in its indicators, a company needs a CRM. Twilead is a very complete all-in-one solution for SMEs and startups. It is easy to learn and helps you in many aspects:
Lead follow-up
Contact management
Opportunity and sales pipeline management
The functionalities of other tools, to centralize all your needs on Twilead.
Request a demo of our CRM here.
The most frequently asked questions to understand sales indicators
How to measure the productivity of a salesperson?
To measure business productivity, you need to use business indicators. Among the various indicators, the turnover and the rate of return are the most used.
How do you know if a salesperson is profitable?
To determine whether a trade is profitable or not, you need to use two main trading metrics: CAC and margin generated. If the margin generated is greater than the CAC, it means that the salesperson is profitable.